Residential fire sprinkler guidelines have historically exempted certain parts of dwellings from sprinkler protection. These exemptions, established under NFPA 13D and NFPA 13R, were initially justified by historical fire loss statistics indicating a low frequency of fires and fire-related fatalities in certain areas such as small bathrooms, closets, attics, and outdoor spaces.
However, residential construction techniques, household habits, and fuel loads have changed dramatically during the last several decades. At the same time, current fire loss figures indicate a shift in both the incidence and severity of residential fires. This poses a crucial question for the firefighting community: are the assumptions that supported sprinkler exemptions decades ago still valid today?
This blog looks at the most recent five-year fire loss data (2020-2024) for single- and two-family homes, as well as multi-family residential buildings. The analysis compares current fire loss experience to historical trends, relying primarily on the National Fire Incident Reporting System (NFIRS) and supplemented by data from the National Fire Protection Association. Fire genesis sites, sprinkler performance, confined versus unconfined fires, and death rates in sprinkler-exempt regions are all discussed in detail.
The goal is not to dispute existing standards, but to provide a data-driven perspective on whether legacy exclusions are still appropriate—or whether evolving patterns necessitate additional technical study and discussion.
Residential Fires and Sprinkler Performance
Certain areas of home occupancies have been exempt from fire sprinkler protection since the adoption of the NFPA residential sprinkler system standards, NFPA 13D (1975) and NFPA 13R (1989). These exemptions were based on the fire loss history, particularly fire deaths, which showed a small number of fires starting in certain regions of residential structures.
This session will examine the most recent five-year history of fire losses in single- and two-family residences, as well as multi-family occupancies (2020-2024). The goal is to compare previous fire loss data to recent data to determine whether the fire loss experience and assumptions from decades ago are still valid.
The data for this analysis is mostly derived from the National Fire Incident Reporting System (NFIRS), which is controlled by the United States Fire Administration. It is believed that 70-75% of the country’s fire departments send incident response data to NFIRS. Other data comes from the National Fire Protection Association (NFPA) and is labelled as such.
Types of Residential Occupancies
The NFIRS classifies residential occupancies into nine categories. Table 1 shows these categories.
Table 1: NFIRS Residential Occupancy Types
| NFIRS Code | Occupancy Type | Typical Examples |
| 419 | 1 & 2 Family | One- or two-family dwellings, detached homes, manufactured homes, mobile homes (not in transit), duplexes |
| 429 | Multi-family | Apartments, condominiums, townhouses, row houses, tenements |
| 439 | Boarding & Rooming | Boarding houses, rooming homes, residential hotels, shelters |
| 449 | Hotel & Motel | Hotels and motels |
| 459 | Board & Care | Long-term care facilities, halfway houses, assisted-care housing facilities |
| 460 | Dormitories | Dormitory-type residences |
| 462 | Sororities & Fraternities | Sorority houses, fraternity houses |
| 464 | Barracks | Nurses’ quarters, military barracks, monastery or convent dormitories, bunkhouses, workers’ barracks |
| 400 | Other Residential | Other types of residential occupancies |
Data Sources
The United States Fire Administration and the National Fire Protection Association are the two organisations that analyse national fire data. The NFPA conducts annual surveys of fire departments to obtain further fire loss information. Both organisations also use national death records from medical providers to better track fire casualties.
The NFIRS database is the major source of data for this report, yet it is commonly acknowledged that fire loss data in NFIRS is underreported. Here are several reasons for under-reporting:
- 25-30% of the country’s fire departments do not engage in NFIRS.
- People injured in a fire may die days, weeks, or even months later, and their deaths are not documented in the NFIRS.
- There’s no fire department reaction.
- A private vehicle transports the injured person to a medical institution without the fire department’s knowledge.
Table 2 compares NFIRS data to NFPA fire death estimates for single- and two-family homes and multi-family structures during the last five years. The NFIRS fire death numbers are much lower than those published by the NFPA.
Table 2: Fire-Related Fatalities by Residential Building Type (2020–2024)
| Data Source & Occupancy Type | 2020 | 2021 | 2022 | 2023 | 2024 | Five-Year Total |
| NFIRS – One- and Two-Family Dwellings | 1,115 | 1,113 | 1,191 | 1,151 | 1,158 | 5,728 |
| NFPA – One- and Two-Family Dwellings | 2,320 | 2,440 | 2,240 | 2,490 | 2,580 | 11,980 |
| NFIRS – Multi-Unit Residential Buildings | 185 | 198 | 213 | 214 | 181 | 991 |
| NFPA – Multi-Unit Residential Buildings | 350 | 400 | 470 | 400 | 340 | 1,960 |
NFPA Estimated Fires and Deaths – One & Two – Family Dwellings
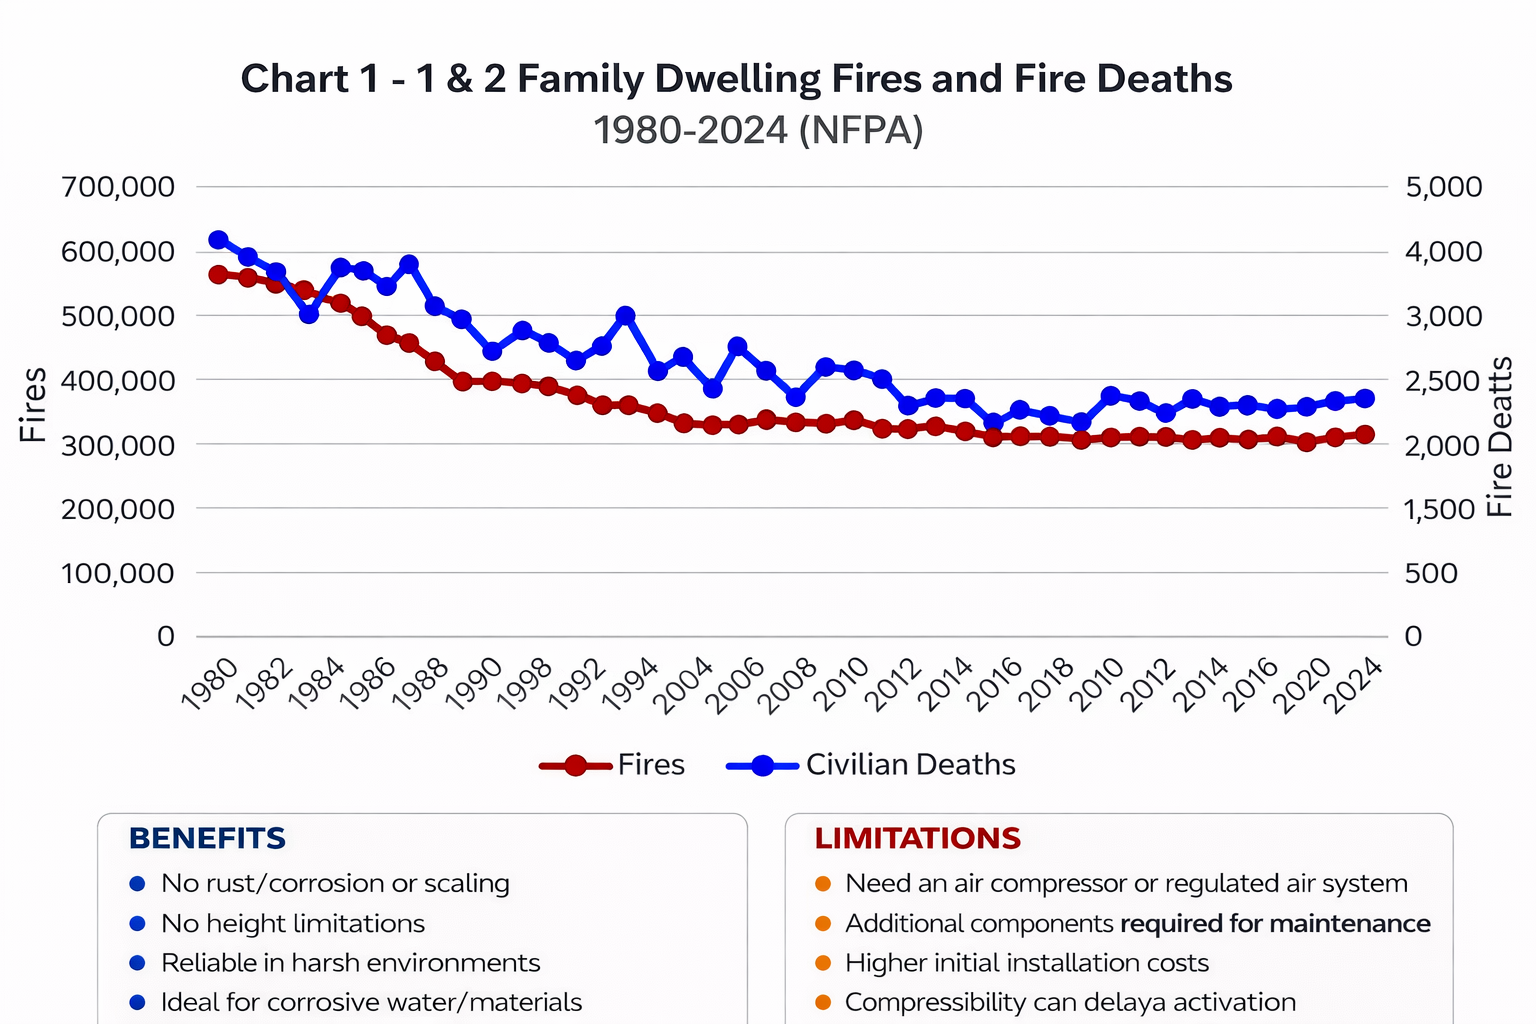
For decades, the National Fire Protection Association has tracked fire deaths. Chart 1 depicts fires and fire deaths in one- and two-family dwellings from 1980 to 2024. While both indicators had been trending downward for many years, recent years have shown an increase in fire deaths.
 NFPA Estimated Fires and Deaths – Multi-Family Buildings
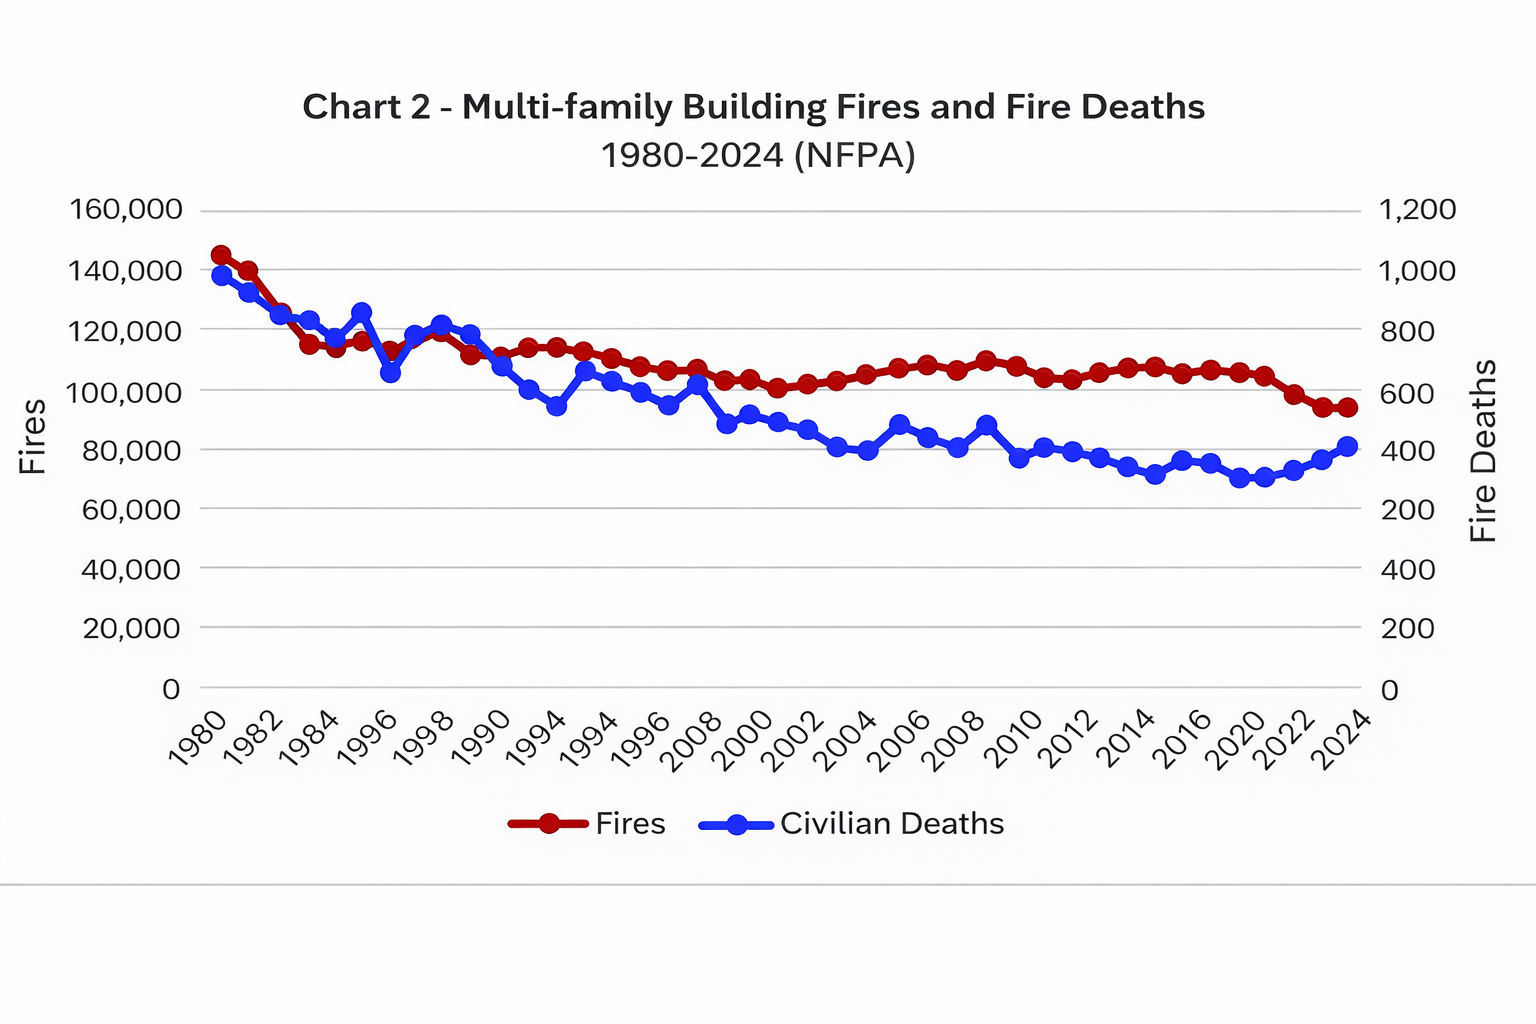
Fires and fire deaths in multi-family buildings have also been declining for many years. Fire deaths in single- and two-family residences have increased in recent years, as seen in Chart 2.
 Confined vs Unconfined Fires
NFIRS classifies building fires as contained (fires that did not spread and thus did not trigger fire sprinklers) or unconfined (fires that spread). Table 3 compares the kind of occupancy and sprinkler performance given in the NFIRS data to calculate the rate of fire mortality.
Table 3: Fire Fatality Rates Associated with Unconfined Residential Fires
| Residential Occupancy & Fire Condition | Total Fire Incidents | Recorded Fire Deaths | Fatality Frequency |
| One- and Two-Family Homes – All unconfined fire incidents | 433,710 | 5,728 | One fatality per 76 fires |
| One- and Two-Family Homes – Unconfined fires without sprinkler protection | 432,790 | 5,723 | One fatality per 76 fires |
| One- and Two-Family Homes – Unconfined fires with effective sprinkler activation | 920 | 0 | Refer to Note 1 |
| Multi-Family Residential Buildings – All unconfined fire incidents | 100,285 | 864 | One fatality per 116 fires |
| Multi-Family Residential Buildings – Unconfined fires without sprinkler protection | 93,438 | 843 | One fatality per 110 fires |
| Multi-Family Residential Buildings – Unconfined fires with effective sprinkler activation | 6,847 | 21 | One fatality per 326 fires |
| Combined Residential Occupancies – All unconfined fire incidents | 533,995 | 6,592 | One fatality per 81 fires |
| Combined Residential Occupancies – Unconfined fires without sprinkler protection | 526,228 | 6,566 | One fatality per 80 fires |
| Combined Residential Occupancies – Unconfined fires with effective sprinkler activation | 7,767 | 21 | One fatality per 369 fires |
Note 1: Five of the fire deaths in one- and two-family homes happened in sprinkler-protected structures. No incidents occurred where the sprinkler system was operational and effective.
The five deaths were as follows:
- A single fatality from a bedroom fire in Georgia was reported as sprinklers “operated but not effective” (the fire was not in an area protected by sprinklers).
- A single fatality from a family room, living room, or fire in Vermont was described as “failed to operate” (the sprinkler system was turned off).
- A single fatality from a Minnesota laundry room fire was classified as undetermined sprinkler operation and roof collapse as a contributing factor.
- In California, two fatalities were attributed to uncertain locations of origin and sprinkler functioning.
Residential Fires by Property Use
From 2020 to 2024, NFIRS received 1,160,224 reports of home fires, for an average of 232,045 per year. Table 4 shows a breakdown of the number of fires each year for various types of residential occupancies.
Table 4: Annual Residential Fire Incidents by Occupancy Category (2020–2024)
| NFIRS Classification Code | Residential Occupancy Category | 2020 | 2021 | 2022 | 2023 | 2024 | Five-Year Average |
| 419 | One- and Two-Family Dwellings | 139,455 | 131,827 | 146,096 | 149,363 | 140,656 | 141,479 |
| 429 | Multi-Unit Residential Buildings | 65,173 | 61,537 | 67,621 | 70,145 | 61,723 | 65,240 |
| 439 | Boarding and Rooming Occupancies | 1,804 | 1,805 | 2,045 | 1,969 | 1,974 | 1,919 |
| 449 | Hotels and Motels | 2,443 | 2,681 | 2,911 | 3,008 | 2,718 | 2,752 |
| 459 | Board and Care Facilities | 912 | 1,019 | 1,086 | 1,094 | 929 | 1,008 |
| 460 | Dormitory-Type Housing | 1,511 | 1,394 | 1,896 | 1,951 | 1,821 | 1,715 |
| 462 | Sorority and Fraternity Housing | 54 | 99 | 121 | 98 | 94 | 93 |
| 464 | Barracks and Similar Group Housing | 184 | 220 | 251 | 238 | 256 | 230 |
| 400 | Other Residential Occupancies | 16,197 | 16,118 | 18,642 | 19,788 | 17,297 | 17,608 |
| — | All Residential Occupancies (Total) | 227,733 | 216,700 | 240,669 | 247,654 | 227,468 | 232,045 |
One-and-Two-Family and Multi-Family Residential Uses
According to Table 4, the most prevalent residential occupancies to experience fires were one- and two-family dwellings (single family homes and duplexes) and multi-family buildings (apartments, condominiums, and townhomes). Fires in one- and two-family residences account for 61 percent of all residential fires, while fires in multi-family structures account for another 28 percent. The focus will be on these occupancies because they account for 89 percent of fires.
One-and-Two-Family Dwelling Fires
Where fire sprinklers were installed in one- and two-family homes, they activated and controlled the fire 90% of the time. They operated but were ineffective or failed to operate in 3 and 7 percent cases, respectively. The cause stated for 65 percent of fires where sprinklers failed to suppress the fire was “system shut off”. Chart 3 depicts the fire sprinkler performance in one- and two-family homes.
The table below lists the twenty leading areas of fire origin as recorded in NFIRS. The 20 places account for 88.0 percent of the spaces where fires occur in one- and two-family homes. These locations of origin account for 89.6 percent of the fire deaths.
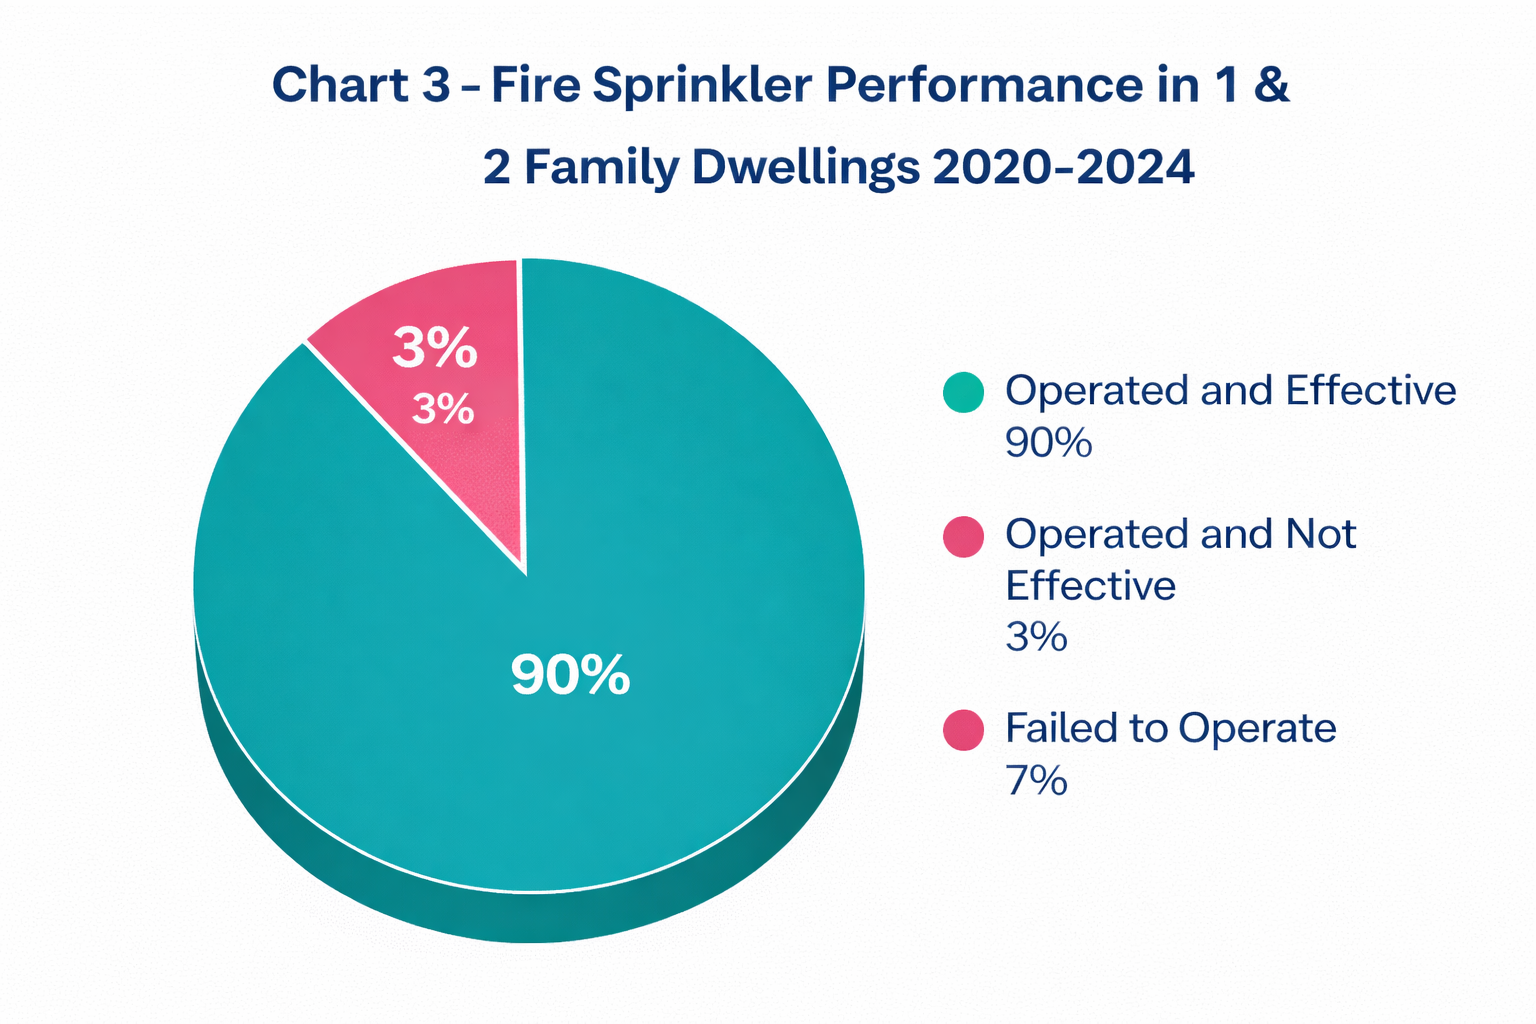 Table 5: Primary Locations of Fire Ignition in One- and Two-Family Homes
| Area Where Fire Began | Fire Incidents (Count) | Share of Fires (2020–2024) | Share of Fires (1996–2000) | Fire Fatalities (Count) | Share of Deaths (2020–2024) | Share of Deaths (1996–2000) |
| Kitchen or cooking area | 100,665 | 23.5% | 22.9% | 538 | 15.9% | 15.1% |
| Bedrooms | 40,967 | 9.6% | 12.4% | 833 | 24.6% | 25.6% |
| Vehicle storage areas (garage, carport) | 27,687 | 6.5% | 3.6% | 100 | 3.0% | 1.2% |
| Living room, family room, or den | 27,443 | 6.4% | 10.5% | 830 | 24.5% | 37.1% |
| Exterior wall surfaces | 21,673 | 5.1% | 3.6% | 26 | 0.8% | 0.6% |
| Other exterior areas | 21,597 | 5.0% | n/a | 24 | 0.7% | n/a |
| Attic or vacant space above top floor | 19,298 | 4.5% | 2.7% | 28 | 0.8% | 0.6% |
| Exterior balcony or unenclosed porch | 16,932 | 4.0% | 1.4% | 92 | 2.7% | 0.6% |
| Laundry or utility area | 14,938 | 3.5% | 3.8% | 48 | 1.4% | 1.3% |
| Bathroom or lavatory | 11,698 | 2.7% | 2.0% | 39 | 1.2% | 1.2% |
| Wall or partition assembly | 11,151 | 2.6% | 1.8% | 29 | 0.9% | 0.8% |
| Other functional areas | 10,534 | 2.5% | 0.3% | 229 | 6.8% | 0.5% |
| Crawl space or substructure area | 8,982 | 2.1% | 2.8% | 48 | 1.4% | 1.2% |
| Courtyard, patio, porch, or terrace | 8,769 | 2.0% | n/a | 38 | 1.1% | n/a |
| Other structural areas | 8,418 | 2.0% | 1.1% | 87 | 2.6% | 1.2% |
| Heating equipment or water heater area | 5,808 | 1.4% | 3.7% | 5 | 0.1% | 1.7% |
| Mechanical ducts (HVAC, exhaust, heating, AC) | 5,571 | 1.3% | n/a | 4 | 0.1% | n/a |
| Open outdoor areas | 5,326 | 1.2% | 0.4% | 1 | 0.0% | 0.2% |
| Other storage areas | 5,101 | 1.2% | 1.2% | 21 | 0.6% | 0.7% |
| Concealed spaces between floors | 4,666 | 1.1% | 0.9% | 13 | 0.4% | 0.9% |
Multi–Family Building Fires
Overall, fire sprinkler performance in multi-family building fires is quite good (see Chart 4 below).

Table 6 displays the twenty major causes of fires in multi-family buildings during the last five years. These locations account for 92 percent of fires and 93 percent of deaths.
Areas of origin were identified for 864 of the 991 fire deaths (87%) in multi-family structures.
Table 6: Predominant Fire Ignition Locations in Multi-Unit Residential Buildings
| Location Where Fire Started | Fire Incidents (Count) | Share of Fires (2020–2024) | Share of Fires (1986–1990) | Fire Fatalities (Count) | Share of Deaths (2020–2024) | Share of Deaths (1986–1990) |
| Kitchen or cooking area | 64,785 | 47.6% | 41.4% | 144 | 19.3% | 12.5% |
| Bedroom | 11,532 | 8.5% | 15.8% | 201 | 27.0% | 33.9% |
| Living room, family room, or den | 7,017 | 5.2% | 9.3% | 215 | 28.9% | 33.8% |
| Exterior balcony or unenclosed porch | 6,596 | 4.8% | 1.7% | 11 | 1.5% | 1.8% |
| Bathroom, lavatory, or locker room | 5,361 | 3.9% | 2.2% | 17 | 2.3% | 0.7% |
| Laundry or wash area | 4,717 | 3.5% | 3.0% | 1 | 0.1% | 0.4% |
| Other interior areas | 2,384 | 1.8% | 0.9% | 13 | 1.7% | 0.2% |
| Exterior wall surfaces | 2,356 | 1.7% | 0.9% | 1 | 0.1% | 0.5% |
| Other outdoor areas | 2,247 | 1.7% | n/a | 1 | 0.1% | n/a |
| Other functional spaces | 2,139 | 1.6% | 2.9% | 45 | 6.0% | 1.1% |
| Wall or partition assembly | 1,916 | 1.4% | 0.9% | 0 | 0.0% | 0.4% |
| Courtyard, patio, porch, or terrace | 1,905 | 1.4% | n/a | 7 | 0.9% | n/a |
| Exterior stairway, ramp, or fire escape | 1,772 | 1.3% | 0.8% | 15 | 2.0% | 0.8% |
| Closet or storage closet | 1,738 | 1.3% | 1.9% | 4 | 0.5% | 1.0% |
| Attic or crawl space above top floor, cupola | 1,700 | 1.2% | 1.0% | 2 | 0.3% | 0.3% |
| Trash or waste chute/container | 1,589 | 1.2% | n/a | 1 | 0.1% | n/a |
| Vehicle storage area (garage, carport) | 1,383 | 1.0% | 1.1% | 6 | 0.8% | 0.3% |
| Corridor or hallway | 1,229 | 0.9% | 2.8% | 4 | 0.5% | 2.6% |
| Heating equipment or water heater area | 1,196 | 0.9% | 2.2% | 2 | 0.3% | 0.6% |
| Egress or exit areas (other) | 1,051 | 0.8% | 0.2% | 5 | 0.7% | 0.1% |
Residential Sprinkler Standards
NFPA 13 is the Standard for the Installation of Sprinkler Systems and has been in use for nearly 130 years. It was designed as the standard for protecting commercial buildings from fire since commercial buildings constituted the majority of sprinkler-protected structures for much of the twentieth century.
Following the broadcast of “America Burning” in the early 1970s, efforts were made to create a sprinkler standard that used faster acting sprinklers and was appropriate for residential settings. In 1975, NFPA 13D, the Standard for the Installation of Sprinkler Systems in One- and Two-Family Dwellings and Manufactured Homes, was issued.
In order to encourage more fire sprinkler installation in hotels and multi-family residential structures, NFPA 13R, the Standard for Installation of Sprinkler Systems in Residential Occupancies up to and including Four Stories in Height, was published in 1989.
NFPA 13’s principal goal is to protect property while also providing a benefit to life safety. The goal of NFPA 13D is solely life safety; it is not concerned with property protection. NFPA 13R is primarily concerned with life safety, although it also includes some property protection for routinely used spaces.
Areas Exempt from Fire Sprinklers
All three sprinkler installation standards exempt specific places from having fire sprinklers installed. Because the focus is on residential sprinkler protection, the exempted areas outlined in NFPA 13D and 13R will be examined for frequency. It should be noted that the terminology used in the fire sprinkler standards and those in NFIRS are not directly comparable. Smaller bathrooms (under 55 square feet) and closets (under 24 square feet) are frequently exempt from sprinkler protection, even though NFIRS does not record their size.
Table 7 lists the regions of NFPA 13D that are exempt from sprinkler protection, as well as the number of fires, fatalities, fires where sprinklers were operational and effective, and fire deaths where sprinklers were operational and effective.
Table 7: NFPA 13D – Fire Incidents and Fatalities in Sprinkler-Exempt Residential Areas
| NFPA 13D Sprinkler-Exempt Location | Total Fires (All Incidents) | Fatalities (All Incidents) | Fires in Sprinkler-Protected Homes | Fatalities in Sprinkler-Protected Homes |
| Bathrooms (under 55 sq. ft.) | 11,698¹ | 39 | 29 | 0 |
| Closets (under 24 sq. ft.) | 3,602² | 10 | 23 | 0 |
| Porches, balconies, and similar exterior spaces | 16,932 | 92 | 11 | 0 |
| Vehicle storage areas (garages and carports) | 27,687³ | 100 | 213 | 0 |
| Attics | 19,298 | 28 | 11 | 0 |
| Penthouse equipment rooms | 1,892⁴ | 1 | 2 | 0 |
| Concealed Spaces | — | — | — | — |
| Crawl spaces | 8,982 | 48 | 3 | 0 |
| Floor or ceiling voids | 4,666 | 13 | 3 | 0 |
| Vertical utility chases | 1,971 | 2 | 0 | 0 |
| Elevator shafts | 6 | 0 | 0 | 0 |
Table Notes
- Includes all fires occurring in bathrooms, regardless of room size
- Includes all fires occurring in closets, regardless of room size
- Fire counts include all vehicle storage spaces such as garages and carports
- Fire counts include all equipment rooms, not limited to those located in penthouses
The table below displays the regions excluded from sprinkler protection under NFPA 13R, as well as the number of fires, fatalities, fires where sprinklers were operational and effective, and fire deaths when sprinklers were operational and effective.
Table 8: NFPA 13R – Fire Incidents and Fatalities in Sprinkler-Exempt Areas
| NFPA 13R Sprinkler-Exempt Location | Total Fires (All Incidents) | Fatalities (All Incidents) | Fires in Sprinkler-Protected Buildings | Fatalities in Sprinkler-Protected Buildings |
| Bathrooms (under 55 sq. ft.) | 5,361⁵ | 17 | 250 | 0 |
| Closets (under 24 sq. ft.) | 1,738⁶ | 4 | 200 | 0 |
| Porches, balconies, and similar exterior spaces | 6,596 | 11 | 494 | 2 |
| Vehicle storage areas (garages and carports) | 1,383⁷ | 6 | 127 | 0 |
| Stairs | 995 | 10 | 30 | 0 |
| Corridors | 1,229 | 4 | 59 | 0 |
| Attics | 1,700 | 2 | 11 | 0 |
| Penthouse equipment rooms | 403⁸ | 0 | 22 | 0 |
| Elevator machine rooms | 124 | 0 | 6 | 0 |
| Concealed Spaces | — | — | — | — |
| Crawl spaces | 889 | 1 | 12 | 0 |
| Floor or ceiling voids | 813 | 2 | 4 | 0 |
| Vertical utility chases | 2,966 | 1 | 177 | 0 |
| Elevator shafts | 32 | 0 | 0 | 0 |
Table Notes
- Includes all bathroom fire incidents, regardless of room size
- Includes all closet fire incidents, regardless of room size
- Fire data includes all vehicle storage locations, such as garages and carports
- Fire data includes all equipment rooms, not limited to penthouse locations
Fire Sprinkler Operation in Exempted Areas – NFPA 13D and 13R
Almost 1,700 fires broke out in otherwise sprinkler-protected structures in areas where fire sprinklers are permitted to be deleted under NFPA 13D or 13R. There were only two fire deaths reported. Both of these included fires that started outside the structure where there was most likely no fire sprinkler protection (described as “porches, balconies, similar exterior areas”).
Possible Area of Concern
Using a threshold of 50 fire deaths (10 per year), the following places of origin exceeded that number. All but two of these happened in places that weren’t sprinkler-protected.
- Bathrooms: 56 (39 in single- and two-family homes, 17 in multi-family structures).
- Porches and balconies: 103 (92 in single- and two-family homes, 11 in multi-family structures).
- Garages and carports: 106 (100 in single- and two-family homes, 6 in multi-family structures).
Due to the climate in most of the United States, providing sprinkler protection outside of the building envelope might be difficult. Porches, balconies, and carports would require specialised sprinklers or protection solutions (such as dry sprinklers or antifreeze systems).
Comparisons – Legacy Exemptions vs. Contemporary Findings
Many of the places of origin with historically low incidence of fire or fire mortality still exist today. For contrast, places with a three-percentage-point change are highlighted below, with plausible explanations:
- Bedroom and living room fires decreased in both one- and two-family houses and multi-family structures, as did the number of fire deaths. This could be linked to altering smoking habits.
- Fires on balconies and porches have increased in both forms of habitation. This could also be due to changing smoking habits (going outside to smoke). There was also a 2.1% increase in fire mortality in one- and two-family buildings due to balcony and porch fires.
- The word “function area, other” in NFIRS is not properly defined. It refers to rooms or spaces that do not include kitchens, bedrooms, living rooms, closets, storerooms, dining rooms, bathrooms, laundry rooms, offices, or heating areas. These could include mudrooms, sewing rooms, fitness rooms, entertainment areas, children’s playrooms, and so on. It is frequently the default choice for fire departments when none of the other options fit neatly. This rise may be due in part to larger residences.
Conclusion
The majority of fires in one- and two-family homes and multi-family buildings begin in normally inhabited locations like kitchens, common rooms (such as living rooms, family rooms, or dens), and bedrooms. These are the areas where fire deaths occur the most frequently. These are also the areas most likely to have fire sprinklers installed.
The fire loss history demonstrates low rates of fire deaths where fire sprinklers are placed, with fire deaths in sprinkler-protected buildings being approximately 80% lower than deaths in non-sprinkler-protected buildings.
According to current data, the majority of regions where applicable rules allow fire sprinklers to be ignored or exempted did not result in a significant number of fire deaths. This was comparable to the data used decades before to justify these exemptions. There were several tendencies, particularly with bathroom fires, which may be worth additional examination due to potentially increased fuel loads in such areas.